Debugging Wet-Lab Data: RNA Carryover in aCGH Arrays
Confirmed
The symptom
Magbio's HighPrep Blood & Tissue DNA Kit seems to preserve a notable amount of RNA in the kits with the following catalog IDs:
PBTS-D16
HPBTS-D96
HPBTS-D96X4
The presence of RNA interferes with the quantification of nucleic acid in the eluted product and presents itself as an artificially high concentration of DNA (although this can be called into question by observing the A260/280 ratio given by your quantification instrument). While this didn't seem to have a significant impact in some downstream PCR applications, this imbalance of RNA manifested itself in abnormally skewed CGH microarrays.
How aCGH works
In a CGH microarray, equal amounts of target DNA and known gender-matched control DNA are competitively hybridized to a grid with several features, or probes. When these DNA sources are tagged with distinguishing fluorescent dyes (via random priming), an equal degree of hybridization will reveal itself as a combination of both fluorescent signals. That is, when there is a heavier presence of control DNA at a specific locus, its fluorescent signal will dominate and vice versa.
Forming a hypothesis
When using any of the isolation kits noted above, I noticed a consistent skew of fluorescent signals in favor of the gender-matched control. In other words, there was not enough of the patient's DNA being hybridized to the microarray grid. The concentration of target and control DNA was measured several times throughout the microarray preparation and was found to be equal throughout — which meant the quantification itself was suspect, not the pipetting. The working hypothesis: something non-DNA was inflating the apparent concentration.
Testing it: PAGE + RNase
I elected to run the genomic and digested DNA through a 10% PAGE to gain more information about this problem. Sure enough my suspicions were confirmed when I saw two bands in the genomic DNA lane that should not have been there. The bands appeared to have a mass of approximately 150bp and 200bp. To rule out the DNA sample as the source of this problem I isolated several different samples with the MagBio kits and ran them all through a PAGE gel. Each genomic DNA isolate appeared to have the two bands depicted in the image below (Lane A):
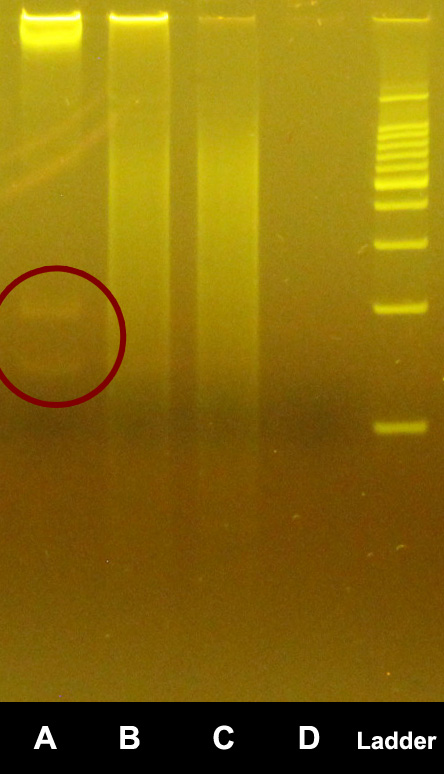
Notably, however, these two bands do not appear in the lanes containing digested DNA (Lane B in the image above). To gather further evidence, I exposed the isolated DNA to RNase at 37°C for 30 minutes and re-ran them through a PAGE gel. The two bands previously observed at 150bp and 200bp were no longer present as depicted in the image below (Lane E):
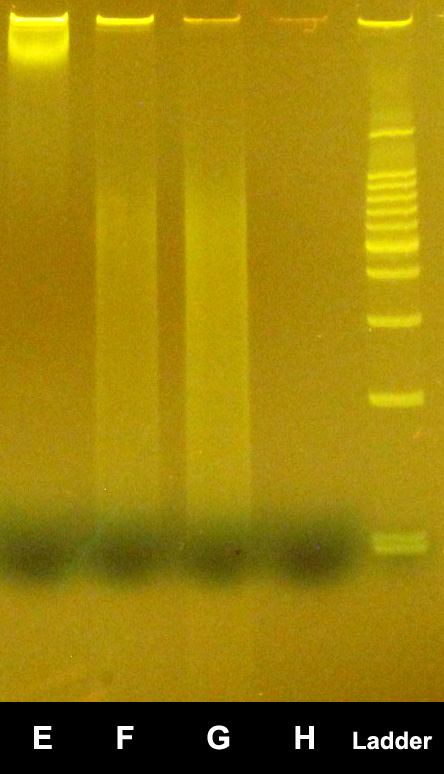
A final observation worth noting is that the well containing the digested DNA appears more intense in the non-RNase gel than it does in the post-RNase gel. This could indicate a large presence of undigested nucleic acids which could have caused hybridization issues on the previously mentioned microarray grid.
The cross-discipline lesson
This is incident response in a lab coat. A metric looked healthy (high “DNA” concentration), the downstream result was wrong (skewed arrays), and the fix came from not trusting the summary number and instrumenting the actual thing — running a gel is the bench equivalent of adding a probe to confirm what a dashboard only implies. Controlled variable (the RNase treatment), a before/after comparison, and a reproducible test across multiple samples: the same method you'd use to confirm a server misconfiguration or validate a patch. The substrate changes; the rigor doesn't.
Related
- We Must Adopt the Biocompute Standard Confirmed
- A VCF File Integrity Checker for Post-NGS Quality Control Confirmed
- Treating Pipelines Like Production Systems Lab / Educational